Open account
Open accountLog In
Open account

Aug 14, 2025

Strategy

What Is the Inside Bar Candlestick Pattern?

In this article
Characteristics of an Inside BarBullish and bearish Inside BarsHow to identify and trade an Inside Bar setupInside Bar trading examplesCommon mistakes to avoidFinal Thoughts
Inside Bar Candlestick

Price charts can be filled with noise, but they can also signal that something is about to happen in the market. In technical analysis, candlestick charts are a good way to study the tugging and pulling between buyers and sellers in real time and over different periods. These candles end up forming patterns that can mean different things depending on where and when they appear. They’re easy to use because they don’t require any indicators or calculations to identify; all you need is your eyes.

One of the simplest and clearest price action patterns you can find on a chart is called an Inside Bar.

Characteristics of an Inside Bar

  • The “mother bar” (first candle) is large.

  • The “Inside Bar” (second candle) is smaller and fits within the high-low of the mother bar.

  • The color of the candles doesn’t matter.

  • The pattern is mostly seen in trend continuations.

An Inside Bar pattern is a formation of two consecutive candlesticks in which the first candle, known as the “mother bar,” has a wide high-to-low range. The second candle, or “Inside Bar,” has a smaller high-to-low range that fits completely “within” the first mother bar candle (the second candle has a higher low and lower high than the first candle, so it doesn’t poke above or below it). The color of the candles doesn’t matter, because Inside Bar patterns are about size and range.

Characteristics of an Inside Bar

This is called a compression setup because the Inside Bar shows that the price width has compressed, or tightened up, with a lower high and a higher low. It is an indication that volatility has gone down, and that the market is kind of catching its breath after a big move. Traders are undecided and taking a pause, waiting to see where the market will go from there. Energy builds up during the pause before breaking out in either direction with strong momentum.

The Inside Bar candle is similar to winding a spring: It keeps getting smaller and tighter, but at some point, when you let it go, the tension releases. When it does, the price can break out sharply.

  • Inside Bars often appear after strong moves. They can form right after the price breaks out in one direction, for example. The market rallies and then settles or consolidates with the Inside Bar, before continuing in the same direction. They can also appear around support and resistance levels. In this case, the price is testing a boundary and getting ready to reverse or break through it.

Bullish and bearish Inside Bars

Inside Bar patterns can be bullish or bearish, depending on when they form.

A bullish Inside Bar will form when the market has been trending upwards. Buyers have been in control, steadily pushing the price higher. When the next candle forms and stays completely within the range of a previous, larger candle, you have found the Inside Bar. This smaller candle is showing you that the market is pausing, but not reversing. If the candle that comes after it breaks above the high of that Inside Bar, it’s a strong signal that buyers are still in charge and the uptrend is likely to continue.

A bearish Inside Bar is formed in the opposite scenario. The market has been trending downwards, and sellers are clearly winning the tug-of-war. The following candle, however, is much smaller and fits entirely within the big one’s range. The big candle is the mother bar, and the smaller one is the Inside Bar. This time, the pattern indicates that there is a pause during a bearish momentum. If the following candle breaks below the Inside Bar’s low, it can be confirmation that sellers are still in control and the downtrend will continue.

The mother bar can be both red and green, regardless of whether the trend is going up or down. The color doesn’t really matter. What matters here is the size and range of the candles, and whether the third candle breaks out.

How to identify and trade an Inside Bar setup

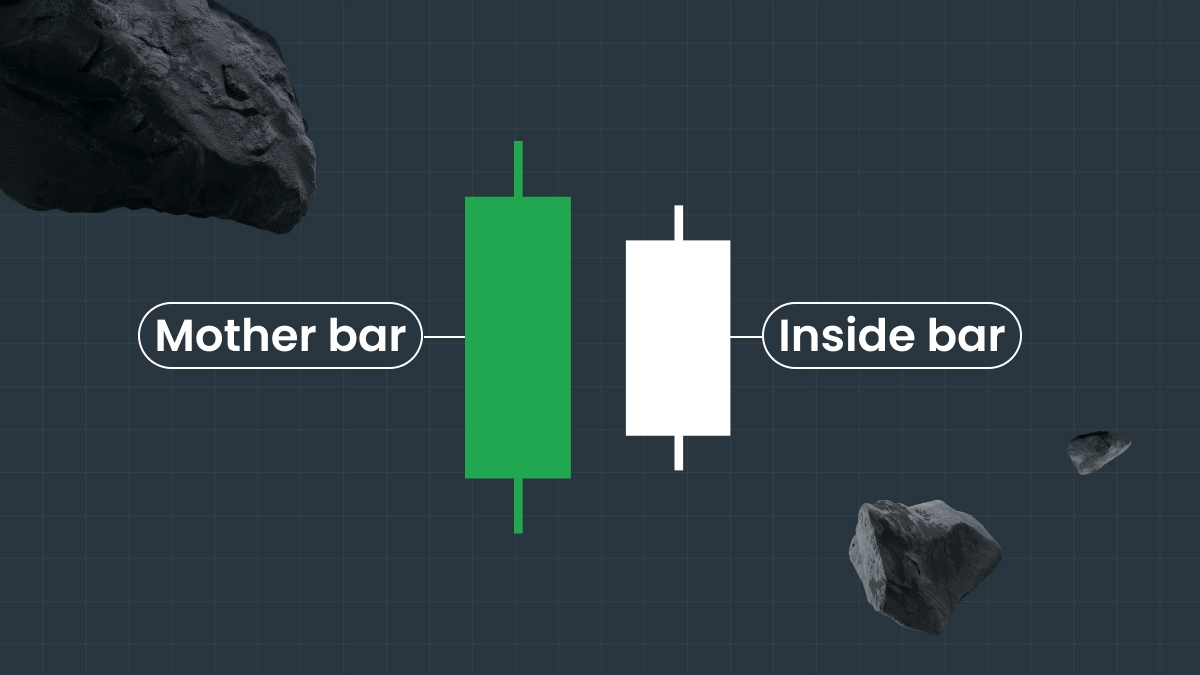
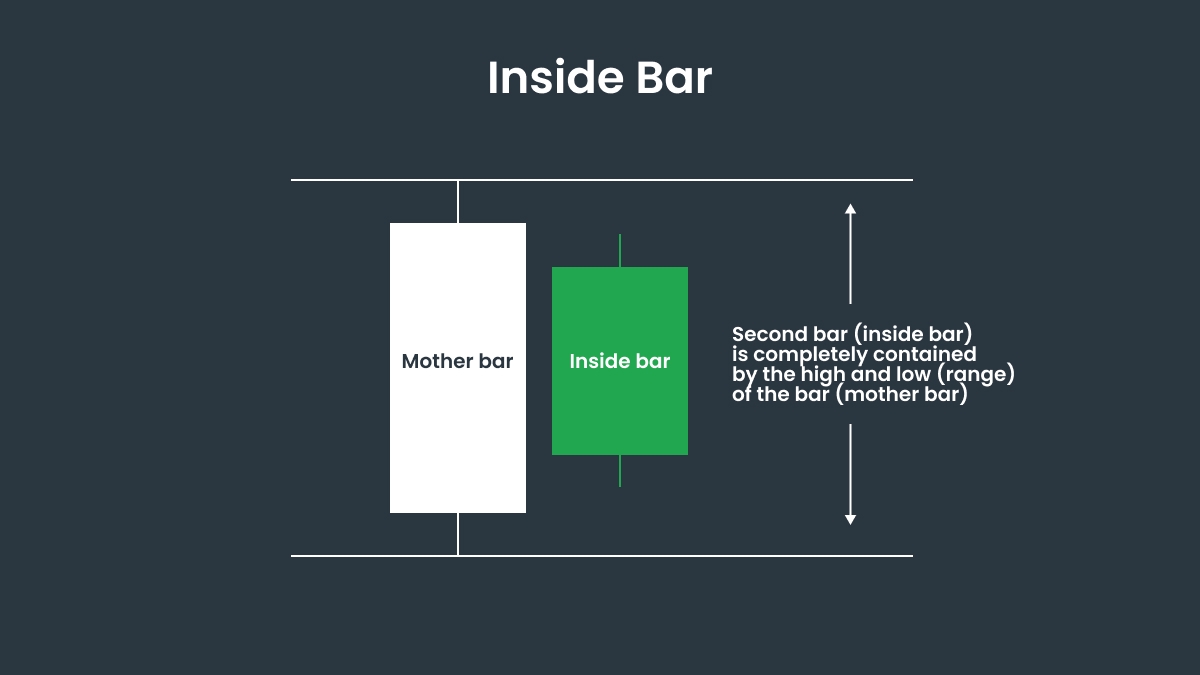
Finding Inside Bars on a chart is pretty straightforward once you know what to look for. You don’t need to check any indicators or make complicated calculations, you can simply spot them with your eyes. Scan the chart and look for a smaller candle that’s completely enclosed within the one that came right before it. It should have a smaller range and body, with a higher low and lower high.

Note: Just because you see an Inside Bar doesn’t mean it’s a good idea to trade it.

Context is important, so there are a few things to keep in mind. Inside bars tend to form around resistance and support levels, so you can keep an eye out for those. It’s also a good sign if you see them forming during a strong trend, because it means that the market is taking a breather. Wait while the price consolidates and the Inside Bar gets compressed.

After the Inside Bar settles, wait for confirmation. Once you see the third candle breaking out higher or lower, that could be a great opportunity to jump in and follow the trend, using a stop-loss to manage risk. If you’re going long, place your entry slightly above the Inside Bar’s high, and if you’re going short, enter just below its low.

Your stop-loss could be set just beyond the mother bar’s low if the trend is upward, or at the mother bar’s high if the trend is downward. This can give your trade room to breathe without being stopped by small price fluctuations. When it comes down to taking profit and closing your position, you can set a limit at the next logical level. This could be a previous high, a resistance area, or even a trendline.

Inside bars work best when everything lines up for a good setup. Make sure you identify a strong trend with clear momentum and potential resistance or support levels. It’s also a good idea to pair them with other tools such as trendlines and the Relative Strength Index (RSI). If you spot a bullish Inside Bar pattern and the RSI is showing the asset is oversold, that adds weight to the idea that the price will break out even higher. If you see an Inside Bar form during a choppy, sideways market, you might want to ignore it. When that happens, breakouts are less reliable and can fake you out more easily.

Inside Bar trading examples

  1. A bullish Inside Bar continuation on the EURUSD daily chart

    A bullish Inside Bar continuation on the EURUSD daily chart

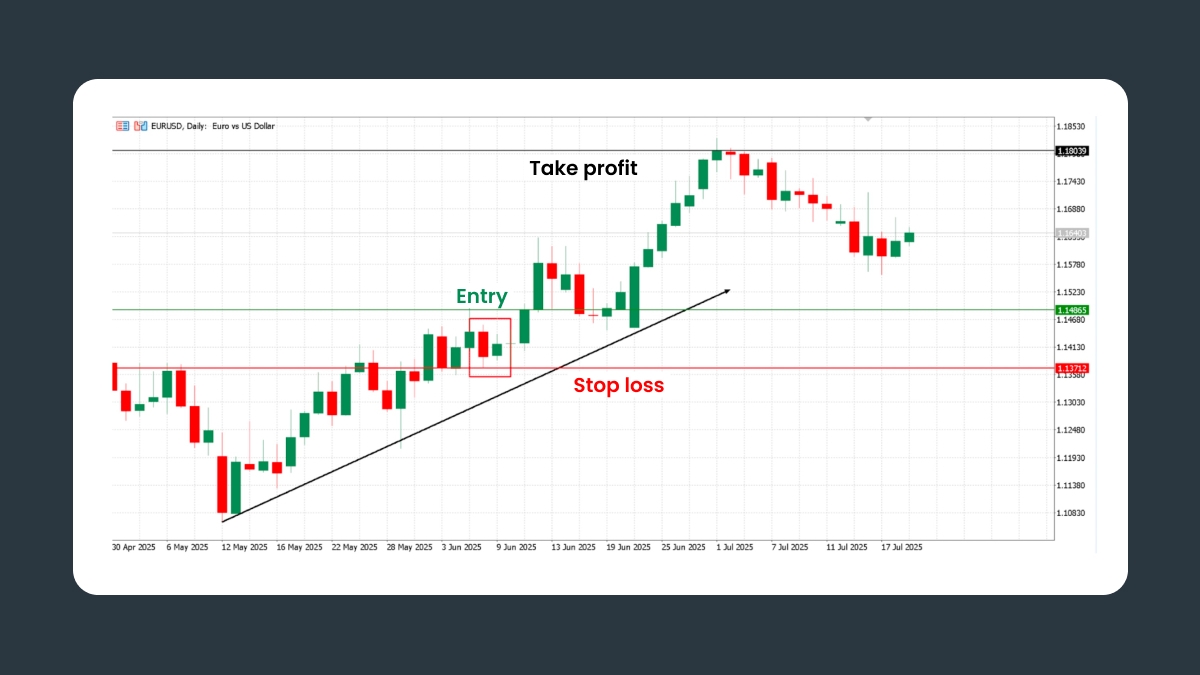
    On this EURUSD daily chart, the market is shown climbing steadily, making higher highs and higher lows. An Inside Bar pattern forms, with a red mother bar and a smaller Inside Bar. The price pauses, and the next candle breaks above the Inside Bar’s high at 1.14865. A trader can enter a long position here, with a stop-loss just below the mother bar’s low at 1.13712, and a limit to take profit around the previous swing’s high of 1.18039.

  2. A bearish Inside Bar on the GBPUSD daily chart

    A bearish Inside Bar on the GBPUSD daily chart

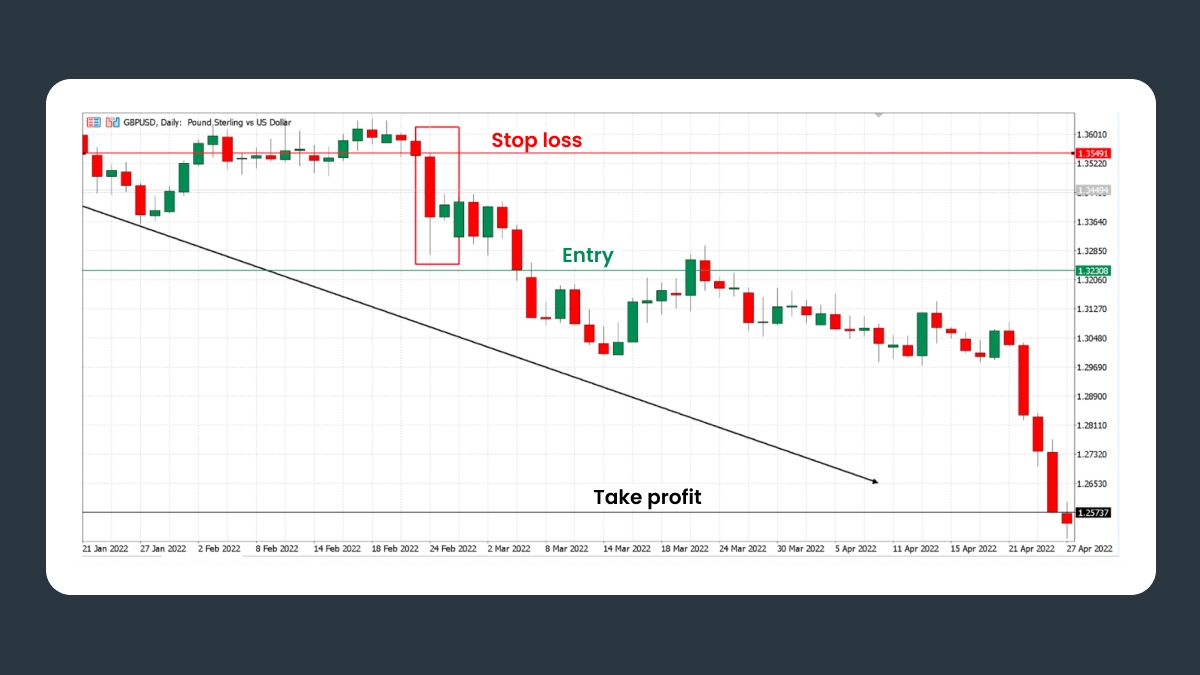
    The GBPUSD chart below shows a large red candle appearing during a strong downtrend. The price then pauses with the formation of a smaller candle, the Inside Bar. The price settles for a bit, until a candle breaks below that Inside Bar’s low at 1.32308, confirming that the bears are still in control. That can be a good entry for a short position, with a stop-loss set just above the mother bar’s high at 1.35491. A limit can be set for profit taking at the next support level, around 1.25737.

Common mistakes to avoid

There are some common mistakes you should avoid making when trading Inside Bar candles.

  • The first one is treating every single Inside Bar as a signal. That’s risky because sometimes patterns will form randomly as noise or not lead to what you are expecting at all. You therefore always have to look at the bigger picture and check for validation, such as whether the pattern forms during a trend, whether there is clear momentum, and whether it’s formed around a support or resistance level.

  • Unless you have a good reason to, trading against the trend tends to also be a mistake. Knowing the context and checking for confirmation with other indicators is no guarantee that the trade will work, but you can at least be sure that it will have a stronger probability of success because it will be based on actual data and not placed at random.

  • Another common mistake is setting your stop-loss too close, right at the edge of the Inside Bar’s high or low. This can be risky because a minor price flicker can trigger the stop-loss and pull you out of the trade even though your setup was solid.

  • Finally, traders sometimes make the mistake of jumping in too early. Just because you spot an Inside Bar doesn’t mean you should act on it right away. It can be good to wait for the breakout candle to show after the Inside Bar. If it is pushing up or down with real momentum, it can be confirmation that the breakout is indeed taking hold. It’s always better to miss a trade than to make a hasty one or get into it at the wrong time.

Final Thoughts

Inside Bar patterns give you a clean view of what the market is thinking at that moment. They’re a kind of moment of hesitation, while pressure builds up before breaking into the next move. When used in the right context, they can be a great, low-risk tool for finding good entry points and catching trends early or riding them for longer.

Inside Bars are popular because they aren’t complicated, and you don’t have to hit yourself over the head with a lot of complex calculations. The main thing is to stay patient and wait for good setups. This kind of pattern doesn’t appear every five minutes, so this strategy can be a little time-consuming. You have to be patient and see them as part of a bigger picture. It’s one thing to identify the pattern, and it’s another to actually know what it means in that specific context.

Knowing about them and what they mean can help you spot them when they do form, and to understand how to trade them if you choose to. Trading isn’t about constantly making trades just to make trades, but about finding the right opportunities and knowing what to do with each one, all while managing risk. Once you’ve got this down, Inside Bar pattern trading is just another card you can add to your deck of skills to use with confidence when the timing and conditions are right.

Share with friends:

Open an FBS account

By registering, you accept FBS Customer Agreement conditions and FBS Privacy Policy and assume all risks inherent with trading operations on the world financial markets.

FBS at social media

iconhover iconiconhover iconiconhover iconiconhover icon

Contact us

iconhover iconiconhover iconiconhover iconiconhover icon
store iconstore icon
Get on the
Google Play
store iconstore icon
Get MT4 on the
App Store
store iconstore icon
Get MT5 on the
App Store

Trading

Company

About FBS

Our social impact

Legal documents

Company news

FC Leicester City

Help Center

Partnership programs

The website is operated by FBS Markets Inc.; Registration No. 000001317; FBS Markets Inc. is registered by the Financial Services Commission under the Securities Industry Act 2021, license number 000102/31. Office Address: The Bentley, #16 Cor A Street & Princess Margaret Drive, Belize City, Belize.

FBS Markets Inc. does not offer financial services to residents of certain jurisdictions, including, but not limited to: the USA, the EU, the UK, Israel, the Islamic Republic of Iran, Myanmar.

Payment transactions are managed by HDC Technologies Ltd.; Registration No. HE 370778; Legal address: Arch. Makariou III & Vyronos, P. Lordos Center, Block B, Office 203, Limassol, Cyprus. Additional address: Office 267, Irene Court, Corner Rigenas and 28th October street, Agia Triada, 3035, Limassol, Cyprus.

Contact number: +357 22 010970; additional number: +501 611 0594.

For cooperation, please contact us via [email protected].

Risk Warning: Before you start trading, you should completely understand the risks involved with the currency market and trading on margin, and you should be aware of your level of experience.

Any copying, reproduction, republication, as well as on the Internet resources of any materials from this website is possible only upon written permission.

The information on this website does not constitute investment advice, a recommendation, or a solicitation to engage in any investment activity.