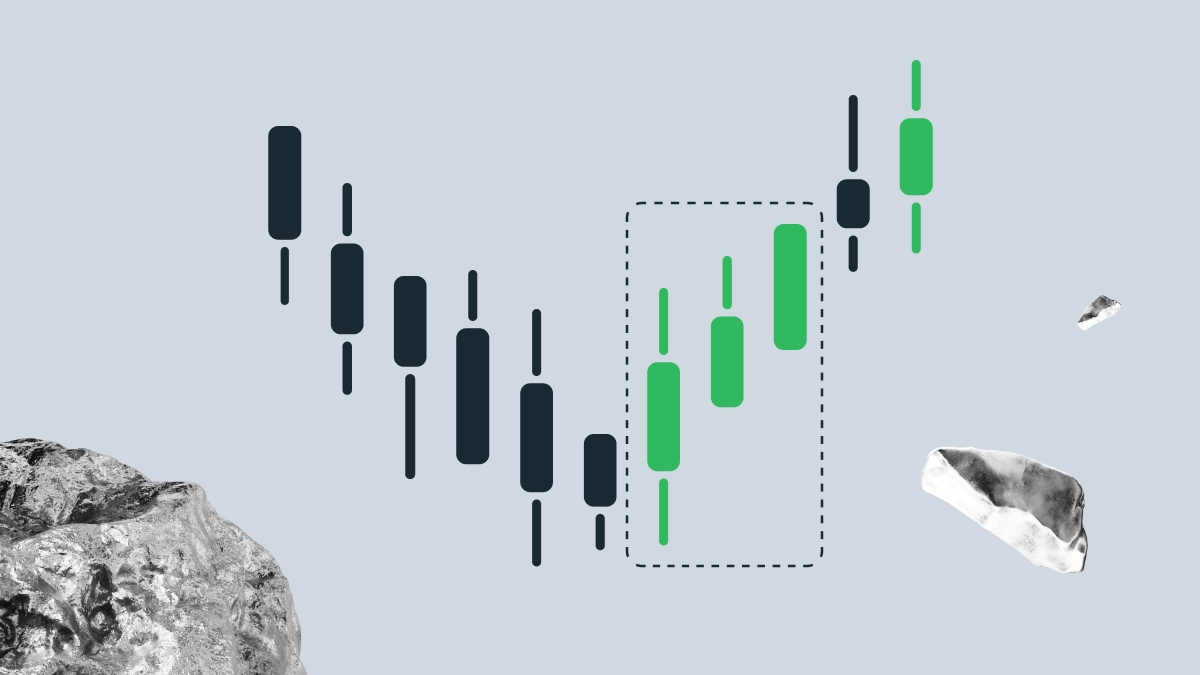
Look at the length of each body. Long bodies show firm pressure, while tiny bodies hint at hesitation. The third candle should not be much smaller than the first two; if it is, demand may be weakening. Lower shadows can appear, but they should stay short. They show buyers quickly lifted the price after a brief dip.
Check where the pattern appears on the chart. If it forms at a known support level or right after a news-driven sell-off, the signal gains weight. Add a simple indicator such as the Relative Strength Index. If the RSI rises from oversold at the same time, the chance of a stronger rally goes up. Together, body size, small upper shadows, growing volume, and supportive context create a high-quality Three White Soldiers setup.
Bullish significance: why it signals reversal
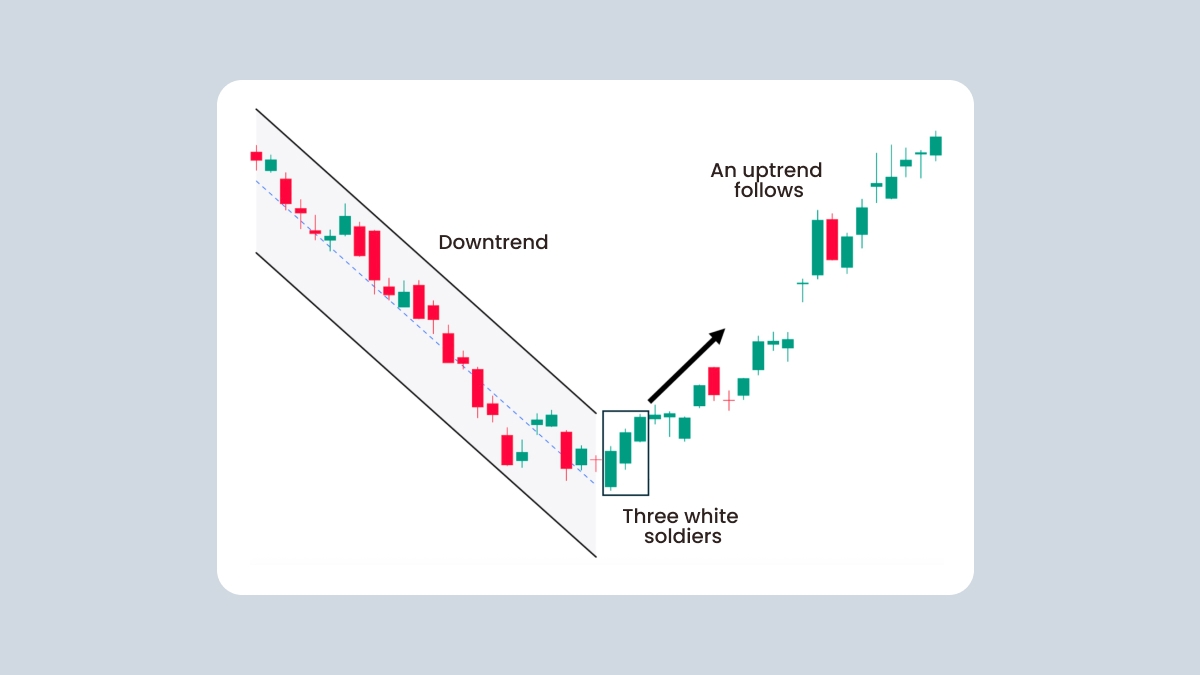
The Three White Soldiers tell you that selling pressure is spent. Bears tried to push the price lower but failed three sessions in a row, while bulls pushed higher each time. The change marks a clear move from a bearish to a bullish mood.
Momentum builds because each strong close attracts more buyers. Large funds often notice the steady rise and begin adding positions. For traders, the pattern signals that buyers now control direction and a new uptrend can begin.
Why this matters:
Early warning. The pattern often appears before other indicators turn up, giving traders an early entry point.
Volume clue. Rising volume across the three candles shows fresh buyers are driving the move, so the rally is more likely to last.
Risk clarity. The low of the first candle provides a clear place for a stop-loss, so risk is easy to measure.
Target planning. Traders can aim for the next resistance level or use simple tools such as a Fibonacci extension to set profit targets.
By spotting the Three White Soldiers, traders gain a structured way to identify the end of a downtrend and plan entries with defined risk.
How to trade on the pattern
Trading with the Three White Soldiers pattern requires a clear look at market background, because the candles alone never tell the full story. First be sure the market was falling or moving sideways before the pattern forms. A rally that begins in the middle of an uptrend offers little edge because buyers already control price.
Rising volume on each soldier strengthens the signal and shows fresh demand. Add a quick check with an RSI or MACD: the RSI climbing out of oversold or a MACD bullish crossover both support the setup.
Entry plans
Conservative traders wait for the next candle to break above the high of the third “soldier.” That extra push confirms buyers still hold control. Aggressive traders enter at the close of the third soldier, but only if volume and a momentum tool agree. A third option is to wait for a small pullback into the upper half of the third candle — this often gives a better price without losing momentum.
Risk control
Place the stop-loss just below the low of the first soldier. If the price dips that far, that’s a warning that the pattern failed. Some traders place the stop a little below the first candle’s low about half of the average candle size so random price noise will not kick them out too soon. Make sure the loss from this stop is only a small part of your account.
Targets
Pick the next clear resistance level as a first goal. If no clear resistance is overhead, apply a Fibonacci tool to the rally and use the 1.618 extension as a farther profit target when momentum is strong. You can also set a fixed risk-to-reward like 1 to 2. After the trade gains the same amount you were willing to risk, move your stop up to breakeven (the entry price), then trail it just below each new higher low to lock in profit.
Extra filters
Skip the pattern if a major news release is minutes away, as spreads can widen and push the price erratically. Look at a higher timeframe to be sure you are not buying into a long-term resistance zone. Finally, log each trade. Over time, your notes will show which entry plan fits your style and which filters improve your results.
Examples of the pattern in real charts
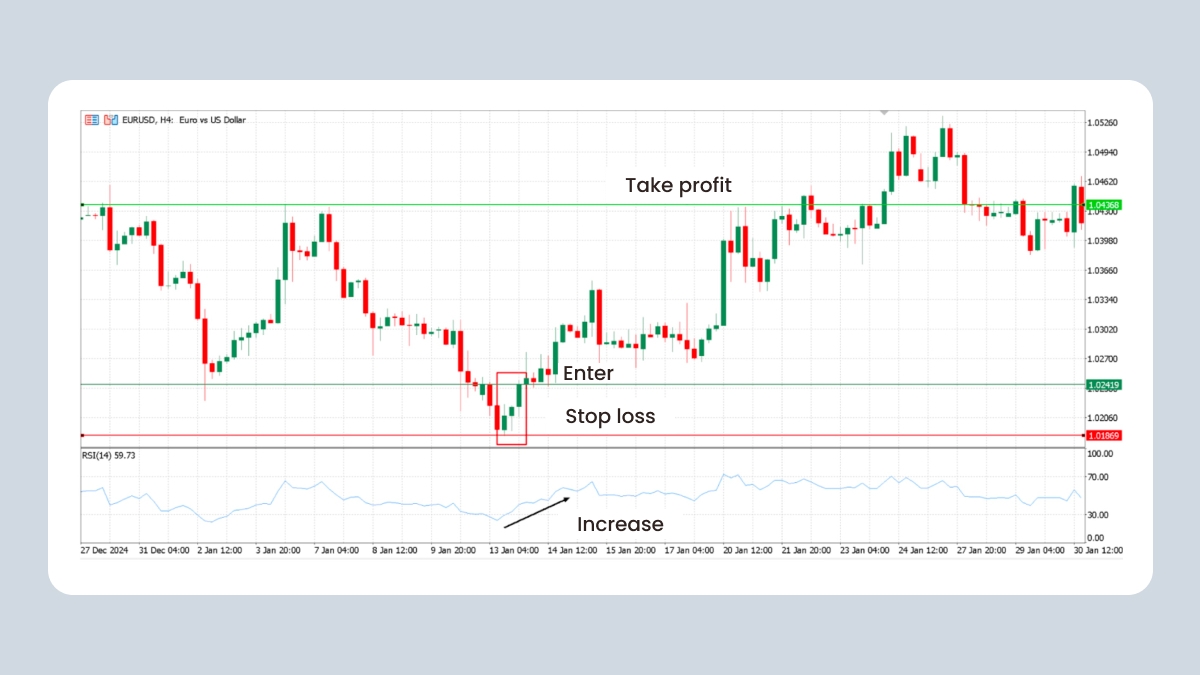
Let us look at a real trade to see how the Three White Soldiers can guide decisions. On a four-hour EURUSD chart, the price had been falling for several days and sellers seemed in full control. Then three solid green candles appeared one after another. The RSI rose from an oversold reading below 30 to above 40, showing momentum was turning.
After the third candle closed, a buy-limit order was placed inside its body, so the trade would trigger if price dipped slightly before rising again. The stop-loss sat just under the lowest shadow of the pattern to protect against a deeper pullback. The first target was a former resistance near 1.0436, which matched a 1 : 2 risk-to-reward plan.
Volume also increased across the three candles, confirming real buying interest. Within two sessions the price reached the target and closed the trade with a full profit. This example shows how combining the pattern with RSI, volume, clear stops, and logical targets can create a structured, low-stress setup.
Limitations and pitfalls to watch for
A pattern alone cannot guarantee a rally. If the RSI reads above 70, the price may already be overbought and ready to pull back. Sometimes the pattern forms inside a wider sideways range; in that case, the price may stall at the range top.
On higher timeframes, the move might still sit inside a larger downtrend, so always zoom out to check direction. Confirm with volume, structure, and momentum tools before acting.
News events are another risk. A major data release can erase the pattern in minutes, especially if liquidity is thin. Low volume during the three soldiers also weakens the signal because fewer traders support the move.